Friday, July 1, 2022

Machine Learning: what it is, what it's not, and links to go deeper

Cassie Kozyrkov is an Artificial Intelligence (AI) / Machine Learning (ML) expert and evangelist at Google. She published a set of training sessions called Making Friends with Machine Learning on YouTube. They are excellent, all six hours of them. To dive deep, watch them.

This article is a summary of her introduction to Machine Learning presentation. 

To get a flavor for her style, lets contrast Wikipedia’s definition of ML with hers. “Machine learning is a field of inquiry devoted to understanding and building methods that ‘learn,’ that is, methods that leverage data to improve performance on some set of tasks.” Vs.  “Thing labeling with examples and truth-finding.”  She expresses complexity with simplicity.

Machine learning is an approach to having computers make an enormous number of small decisions.

  • It is fundamentally different from traditional computer programming
  • Artificial intelligence succeeds at very complicated tasks that programmers can’t write instructions for by hand
  • Think of it as automating the ineffable
Let’s compare the two approaches.

A traditional computer program accepts information input and processes it via statements executed in sequential, conditional, or iterative order. The program’s code is a human readable collection of statements, structures, and algorithms that automate a process. More simply, it is a human readable recipe for solving a problem.

In contrast, machine learning uses a lot of raw data and sophisticated math to generate algorithms. The implementation details of all of this are beyond human comprehension at anything but an abstract or theoretical level. They are beyond our comprehension because of the sheer volume of equations and because of their use of dimensions beyond length, width, depth, and time. We humans cannot practically problem solve in over four dimensions. But with computer automation, our math can.

Data Scientists and Engineers don’t code the generative algorithms, they select them from a finite number invented by researchers, for example Neural Networks, Random Forests, or Logistic Regression. They feed the generative algorithms mountains of data and consume enormous amounts of compute resources to generate the Machine Learning algorithms, called models, that are the computer programs they “train.”

Data Scientists and engineers train their Machine Learning models by providing huge data sets of labeled examples to the researchers’ generative algorithms. Here’s the general structure of the data:

  1. An “instance” is an example a.k.a. an observation; a row in a spreadsheet.
  2. A “label” is the answer, a.k.a. the target, the output, or the ideal output, for the example.
  3. A “feature” is something we know about the example a.k.a. a variable, a column of a spreadsheet.

The algorithms iterate over the instances, evaluating their features, trying an astronomically high number of variations until they, maybe, learn to discern the correct labels for not only their training data but also for data they have never seen, i.e., they didn’t train on. For example, the ability to recognize the sound of the words “hello there” spoken by 100 million unique voices.

More formally then, Machine Learning is an approach to making or computing many small decisions that involve algorithmically finding patterns in data and using these to make recipes that deal correctly with brand new data.

Machine Learning was first realized in code in 1952, and its theoretical birth, the invention of the neural network, occurred in 1949. But it only took off when compute and storage resources became fast enough and large enough to handle the massive processing requirements needed to generate useful models.

Despite the illusion created by talking to Alexa or Siri, the Machine Learning models we use daily are not conscious or ”alive” in any meaningful sense. Humans are required throughout. We curate the enormous labeled data sets of examples. We select and try many models. We verify the results. Over time even our successful models are imperfect and require additional human intervention to identify emergent mistakes and then regenerate the models to maintain their accuracy. If you are its owner, think of an ML model as a high-interest credit card that is never fully paid back.

Cassie's view is that the biggest problem in AI is using all the right math to answer the wrong question. “We must ask the right questions and solve the right problems. Machine learning will optimize whatever we give it. Give it the wrong thing and you’re in big trouble. Much like the genie in the lamp, the genie is not the problem; it is the wisher. And the wisher does not have to be malign. They can just be foolish and not think through the likely outcomes of their choice.”

The type of label needed drives the high level approach to machine learning: classification or prediction. 

  1. Binary classification: image recognition - cat/not cat.
  2. Multi-class: image recognition of a cat, dog, or weasel.
  3. Prediction of a numerical outcome $12.14, 10.67, etc.

Types of machine learning:

  1. Supervised learning: for any example you give the system, you have the correct label handy. Keywords: labeled data.
  2. Unsupervised learning is the search for patterns. You have data but no labels. Keywords: data mining and clustering.
  3. Semi-supervised learning is the blend of supervised and unsupervised where we have some, but not all, data labeled. Keyword: partial guidance.
  4. Reinforcement learning. Here, the system takes a sequence of actions towards a goal that leads to success or failure. For example, learning to play a game. Keywords: sequence of actions, reward/punishment, delayed feedback, system influences its environment (and inputs).

Cassie points out that reinforcement learning is really, really hard. It rarely works, but when it does its magic. Think of self driving cars. Their modeling is based on game algorithms.

So how do you know if machine learning might be a fit for your problem? We’ve already covered that the problem should be ineffable, meaning it’s not practical for a programmer to write code to solve it. The next question is: can you imagine what sort of decisions or labels would the machine learning system make for you? If you cannot answer that question, then stop. It’s too early. You’ll need to derive insight by analyzing the problem space using descriptive analytics first. 

Which brings us to a basic process description of Data Science:

  1. Use descriptive analytics to get inspired and discover a problem machine learning may solve for you. 
  2. Problem in hand, use machine learning to generate a recipe, i.e., use technology to create the model. 
  3. Test the efficacy of the model using statistics. Remember the Genie; decide wisely.

Links to Cassie’s videos:

  1. http://bit.ly/mfml_part1
  2. http://bit.ly/mfml_part2
  3. http://bit.ly/mfml_part3

Link to Cassie on Medium: https://medium.com/@kozyrkov

Thursday, June 16, 2022

Principles, motives, and metrics for software engineering

I was recently asked for a point of view on organizational metrics for a new group of Agile Teams at a big software engineering shop. The conversation led to this quick essay to collect my thoughts. Big topic, short essay, so please forgive omissions. 

Context

Business circumstances and organizational philosophy dramatically influence metric and measure choices. At one extreme frequent releases delivered when ready is the best business fit. On the other extreme infrequent, date-driven deliveries addressing external constraints are the appropriate, if uncomfortable fit. While they share the basics, the level of formality, depth, and areas of focus are different. Other considerations abound.

Another key dimension of metric selection is the type of work. When dealing with garden variety architectural and design questions, the work has a clear structure and common metrics will work well. However, when there are significant architectural and design unknowns, it is hard to predict how long the work will take; thus, common metrics and measures are not as helpful.

So for this essay, I am assuming:

  • Multiple Agile teams with autonomy matched to competency, or put another way, as much as they can handle.
  • Teams own their work end to end, from development through operations.
  • There are inter-team functional and technical dependencies.
  • Frequent releases are delivered when ready (I won’t go deep into forecast actuals, etc.).
  • A traditional sprint-based delivery process (I am not saying that’s best, but it’s popular and easy to speak to in a general-purpose article).

Motivations, What Questions are we asking?

  1. Are we building the features our customers need, want, and use?
  2. Are we building technical and functional quality into our features?
  3. Given the business and market circumstances, is the organization appropriately reliable, scalable, sustainable, and fair?
  4. Is our delivery process healthy and are our people improving over time?

Principles

Single metric focus breeds myopia - avoid it: asking people to improve one measure will often cause that measure to appear to improve but at the cost of the overall system. This leads to…

Balance brings order: when you measure something you want to go up, also measure what you don’t want to go down. You want more features faster - what’s happened to quality? Are we courting burnout? It is easy to create a perverse incentive with a manager’s “helpful metric.” 

Correlation is not causation: It is hard to “prove” things with data. Not because the data is scarce, though it often is, but because there are frequently many variables to consider. Understanding is a goal of measurement. Yet often the closer you look, the more variables you see and the less clear the relationships may become. So, be warned, if only “a” drives “b” it is likely you are missing “c” and “d,” etc. Be cautious.

Competence deserves autonomy: a competent team should choose how to manage and solve their own problems, including what to measure. Since a manager has problems too, it’s the same for them. As long as the leader can explain why they need it and how it should help, they’re good. Force it without the team’s buy-in, it likely won’t work, anyway.

Wisdom is hard won: Metric targets are seductive. Having no targets comes across as having no goals. Aimlessness. But bad targets are pathological and that’s worse. A competent, productive developer who’s not improving is better than one held to myopic targets they neither want nor value. Unless your aim is a dramatic change, set targets relative to current performance, not an ideal. 

If you demand dramatic change, you better know what you're doing. No pithy advice for that. Good luck.

Measures and Metrics

Based on the circumstances, the level of formality and utility will vary.

Customer Value Measures

  1. Feature use - does our customer use the feature we built?
  2. Net promoter score - do they love our features enough to recommend them to others?

Delivery (team level)

Sprint Metrics - simplistically said: Push work into a time box, set a sprint goal, commit to its completion, and use team velocity to estimate when they’ll be “done” with something. Most argue the commitment motivates the team. Some disagree. 

Cumulative flow for Sprint-based work

  • Velocity or points per sprint
    • Should be stable, all else being equal. Sometimes all else is not equal, which doesn’t mean something needs “fixed,” but it might mean that. Sorry.
    • Using Average Points Per Dev can reduce noise by normalizing for team size/capacity changes week to week. 
  • Story cycle time
    • Time required to complete a development story in a sprint. When average cycle time exceeds 2/3’s of sprint duration, throughput typically goes down as carry over goes up.
    • In general, analysis of cycle times through work steps across processes and teams can be very revealing (enables you to optimize the whole). But, that doesn’t just fall out of Cumulative Flow.
  • Backlog depth
    • Generally indicates functional or technical scope changes
    • Doesn’t capture generalized complexity or skill variances that impact estimates
  • Work in process per workflow step
    • Shows when one step in the workflow is blocking work

Work allocation

When one team does it all, end to end, keeping track of where the time goes helps understand what you can commit to in a sprint. Also, products need love beyond making them bigger, so you need to make choices for that.

  • % capacity for new features
  • % capacity for bugs/errors
  • % capacity for refactoring and developer creative/ learning time
  • % production support

Functional Quality

  • Bugs
    • Number escaped to production - defects
    • Number found in lower environment - errors

Technical Quality

  • Code quality
    • Unit test coverage %
    • Rule violations - security, complexity (cognitive load)... long list from static analysis tools
    • Readability - qualitative, but very important over time
  • Lower environments (Dev, Test, CI tooling, etc.)
    • Uptime/downtime
    • Performance SLAs

Dependency awareness

Qualitative, exception-based. How well does the team collaborate with other teams and proactively identify and manage dependencies? 

Team morale

Qualitative, could be a conversation, a survey, observation, etc.

Mean time to onboard new members / pick up old code

Most engineers don’t like to write documentation. Sure, “well-written code is self-documenting” but they also know better. A good test is how long it takes to onboard new members / pick up old code. 

Estimating accuracy (forecast vs. actual variance)

  • Top-down planning - annual or multi-year. Typically based on high-level relative sizing.
  • Feature level - release or quarterly level. Typically, a mix of relative sizing at a medium level of detail.
  • Task/story level - varies by team style. May be relative or absolute (task-based).

Cross-team metrics

  • API Usability, qualitative - for teams offering APIs how much conversation is needed to consume the API
  • Mean time to pick up another team’s code - documentation and readability
  • Cross-team dependency violations

So, there you have it. Some thoughts on principles, motives, and metrics for software engineering. Comments welcome. Be well. 

Friday, June 10, 2022

Coaching and Creating a Culture of Learning


Coaching is a skill
An ability to help others improve a skill through a combination of
  • Observing behavior related to a particular skill
  • Asking questions and listening to understand strengths and opportunities for improvement
  • Providing support and feedback via a mix of
    • asking and telling
    • observing and showing
    • getting involved and leaving room for independent learning

It is about facilitating learning

Mutual respect and purpose enable success anything else courts failure.


Learners move through stages of competence


Coaches ask a lot of questions to engage


Coaches give good feedback, a model
  • Have a conversation.
  • Avoid making judgments or expressing personal feelings about what you have seen.
  • Remember, it’s not what you say; it’s how you say it.
  • Be supportive and respectful when giving feedback.
  • Maintain and enhance self-esteem when giving feedback.
Coaches balance purposeful interactions
Approach coaching sessions on a case-by-case basis…
Seek to make themselves obsolete for this skill for this coachee
Deal effectively with the emotions that come up so that the coachee values the experience (even when it is not fun)…
Avoid the “expert’s mistake” An expert often shares so much information that the learner gets lost.  
An expert may:
  • Operate from ego (look at how much I know); or
  • May feel like they need to share everything they know so the coachee won’t make a bad decision, or simply 
  • Forget that a learner can only absorb a certain amount of information at a time
Create a Culture of Learning, Apply Adult Learning Theory
Malcolm Knowles introduced Adult Learning Theory in 1968. The fundamental pillars are that 
  • Adults want to participate in both the planning and evaluation attached to their instruction.
  • Experiences, both good and bad, serve as the backdrop for all learning activities.
  • Adults first gravitate towards learning things that are directly relevant to their job or personal life.
  • Adult learning centers on problems, not subjects.
Adults generally learn
  • 10% through Traditional methods (reading and lectures to learn concepts and facts)
  • 20% through Relational methods - learning from others
  • 70% through Experiential methods - learning on the job
Coaching is exercised in Relational and Experiential methods.

Tips:
  • Quiz students before each traditional learning session so they may ask themselves:
    • What do I already know? (before)
    • What am I to learn in this session? (when I’m done)
  • Quiz students after each traditional learning session to support retention.
  • Use “spaced repetition” for facts and concepts that must be retained for long periods of time
    • Spaced repetition is an evidence-based learning technique that is usually performed with flashcards. 
    • Newly introduced and more difficult flashcards are shown more frequently, while older and less difficult flashcards are shown less frequently in order to exploit the psychological spacing effect. The use of spaced repetition has been proven to increase the rate and retention period of learning
The Adult Learning Model


Applying the Adult Learning Model
The flow below illustrates a SME, subject matter expert, conducting a set of “brown bag” learning sessions over a number of weeks. This approach has delivered significant and sustainable benefits and builds a culture of learning when it takes root.

Here is a more sophisticated illustration based on a coach joining a team to teach a complex skill requiring 3-6 months of daily engagement. 


Thursday, April 21, 2022

5 Problems Big Data Architectures Solve


The breadth of Big Data and Analytics technical architecture can seem intimidating. Despite its diversity, though, it solves a handful of problems. It makes trade-offs and surprise, just moves work around to meet its performance goals.

I’ll attempt to describe the key problems and the tradeoffs simply. These basics should help demystify architecture selection and troubleshooting for technology leaders new to the space.

Big Data is well, big. Too big for one machine to process quickly and store reliably. So, we need a lot of machines, working in parallel, and will have to coordinate their activity. How many? In the extreme, thousands.

Data may stream in so fast that it is hard to even ingest it without falling behind. With so much distributed data, finding and reading it quickly becomes a problem. Finally, reliable storage requires multiple copies and reliable coordination requires a way to handle coordinator failure.

In short, the problems are to:

1. Scale write, read, and processing performance

2. Parallelize work across nodes, i.e., machines.

3. Efficiently share data and coordinate activity across nodes.

4. Reliably process and store data despite one or more node failures.

5. Meet your business needs for data consistency and availability.

Problem 1: Scale write, read, and processing performance.

Writing

At scale, simple things like reading and writing become hard. The physical world is unforgiving, so learn your constraints. You can’t have it all. Ultra fast writes typically means slower reads and vice versa. When you can solve for both, accept that you’ll create a new problem. There are no free lunches at scale.

In a nutshell, store your data in ways that make it easy to do what you need to do with it. And address the consequences. Let’s look at some examples.

A traditional transactional database needs data consistency, so its relational model limits data redundancy. It needs reasonably fast reads and writes, so it defers some of its disc housekeeping, index and other storage optimization to off hours. Just don’t forget to schedule it!

Specifically, most Relational Databases record where they store their data on disc in real time using B+ Trees. Each file write causes multiple updates to the B+ Tree and takes time. To avoid more delay, it writes data somewhat haphazardly to disc blocks, slowing reads. The deferred work moves to clean up jobs. 

Source: Wikipedia

What if we need faster writes? Well, something has to give. Cassandra, for example, provides faster writes, strong read times, and lightweight transactions. The cost is more data redundancy and less consistency. You also have to agree to less flexible read options — sorts move from query parameter to design decision. But wow, very fast.

To do this, Cassandra, and others, e.g. Kafka, use a Log Structured Merge Tree. Writes are batched based on available RAM (memtables) and appended to a log (SSTables). Deletes and modifications are appended to the log rather than applied to the underlying data store. A compaction process handles data storage changes and optimizations, again in batches.

Source: Creative Coder

These are two common options. There are other optimization strategies that trade off various constraints.

Reading

Let’s stick with the familiar. A traditional relational database, Oracle, SQL Server, DB2, is row oriented, i.e., stores rows together in files on a drive. Rows offer a good fit for transactional use cases, lots of fine grained, surgical inserts, modifications, etc., and AVRO is a common file format. However, analytical use-cases frequently aggregate one column of data from thousands of rows and thus must read more than they need.

The heuristic is to store data the way you want to use it. Analytical use cases benefit from column oriented file structures, like Parquet. They read only what they need to and, given their columns, have homogenous data; so they compress to save storage space.

As always, there is a tradeoff: writes are slower. In fancy language, these structures are great for write once read many workloads. Column database examples, Redshift and HBASE.

Source: datacadamia.com

Yes, there are hybrids. Cassandra and BigTable can save a set of columns (a family), whose data is frequently used together.

You may also optimize for data access granularity. If you need to process large grained objects (files) one by one, then an object storage solution like AWSs S3 fits the bill. It uses a key-value pair where the value is the object, e.g. BLOB, Json file, etc. If you need fine grain access to groups of structured data elements, then consider a low-latency, high consistency, key-value/document database solution like AWSs DyanmoDB.

Note the storage types below. It fits this discussion well, but I’ll hand wave it and just provide a link so if you don’t already know, you can learn more about them. 


Source: Cloudain.com

Problem 2: Parallelize work across nodes, i.e., machines.

Since one machine, node, can’t do the work quickly enough, we must parallelize it. We need to abstract away the complexity of dealing with all the different nodes so the developer can focus on the business problem. Map Reduce is one such solution. How it abstracts away the complexity we’ll ignore and simply look at its workflow, which is basic.

Map Reduce does something simple. It collects some data and maps it into a structure, say sales for the week. And then reduces it into something useful, say the min, max, and average sale volumes for the week. The developer writes the logic for the job and the Map Reduce application finds the nodes with the data and runs the logic on each machine in parallel, and then stores it.

Source: Hadoop In Practice

While good for simple tasks, the Map Reduce framework causes a developer to create a lot of jobs and knit them together. Imagine quarter-end reporting as a long list of jobs. At Big Data scale, that is difficult to manage. As we’ll see, this is a solved problem.

Big Data Analytics require complex online analytical processing requires inner joins, outer joins, etc. Frameworks like Tez, HIVE abstract away that NoSQL/SQL complexity using algorithms expressed and coordinated via Directed Acyclic Graphs (DAGs). These graphs flow work from left to right and do not loop.

Source: Medium

DAGs are expressive and easy to use and have become a de facto developer standard for expressing simple and complex workflows, i.e., they are not just powering low level frameworks. Examples include Spark, Beam, Airflow, Kubeflow, and ML pipelines…

ML uses interesting graphs. Feed-forward Neural Networks traverse a graph in one direction, have layers, and evaluate loss at the points where layer nodes meet. Convolutional Neural Networks, and others, use bi-directional traversal, to enable Gradient Descent and Backpropagation.

Source: Brilliant.org 

Problem 3: Efficiently share data and coordinate activity across many nodes.


Many machines working in parallel mean many logical and physical boundaries to cross, process, user space, system space, network, and storage mediums, etc. Given speed is a goal, boundaries are a toll, they take time to cross.


Process as much data locally as is practical, I.e. minimize the amount of data passed across the network, processes, or storage boundaries on a node to reduce latency. As mentioned earlier, Map Reduce handles some of this heavy lifting. However, remember it passes data across jobs by persisting it.


As an example, in the Hadoop ecosystem, YARN applications may keep nodes (VMs) active across jobs to keep data in memory for a subsequent workflow step and to avoid VM startup times. The tradeoff is inactive VMs consume memory and may starve others. And there are other examples, Spark uses Resilient Distributed Datasets (RDDs) as a form of shared memory.

Source: tutorialspoint.com

Stating the obvious in distributed systems, avoid workflows that allow hosts to block each other’s tasks, and prefer asynchronous vs synchronous cross node communication. Onto coordination.

Coordination

Coordination happens at multiple levels. We'll keep it simple. Let’s define “coordinate” to mean managing work across nodes. The next section will address failures.

Continuing to use the Hadoop example, let’s look at the “abstracted complexity” that allows developers to not worry about work distribution. There are three layers:

1. YARN (Yet Another Resource Manager) - yep, manages applications, handles some scheduling.

2. MapReduce - organizes where mapper and reducer work will happen (runs in YARN as of Hadoop 2).

3. HDFS - Hadoop Distributed File System - determines where data goes where it is.

Source: Hadoop In Practice

The above diagram highlights a common coordination model, master/slave, or leader/follower, if you prefer. Here, the leader is the authoritative source of what data is “correct” and which node should do what and when. Leader/follower relies on an primary/backup data replication model. A set of changes comes in, let’s say to add a value, and then update it three times. The leader will apply those changes and send the final value to its followers. This can create a single point of failure, so often a backup master who is aware of all the changes. As long as both of them don’t fail at once, all is well. Over two masters? Then there are some overlaps with peer-to-peer. 

In centralized distributed computing, leader/follower and peer-to-peer are the main options.

In peer-to-peer, any node can be a leader or a follower; all nodes have the same capabilities and their function, leader or follower, is context dependent. Here, the data replication model is state machine based. While there is a leader, it shares all incoming changes with the other nodes in its cluster so that anyone of them can become the leader if the current leader fails. 

Source: The Log: What every software engineer should know

Source: Tutorialspoint.com

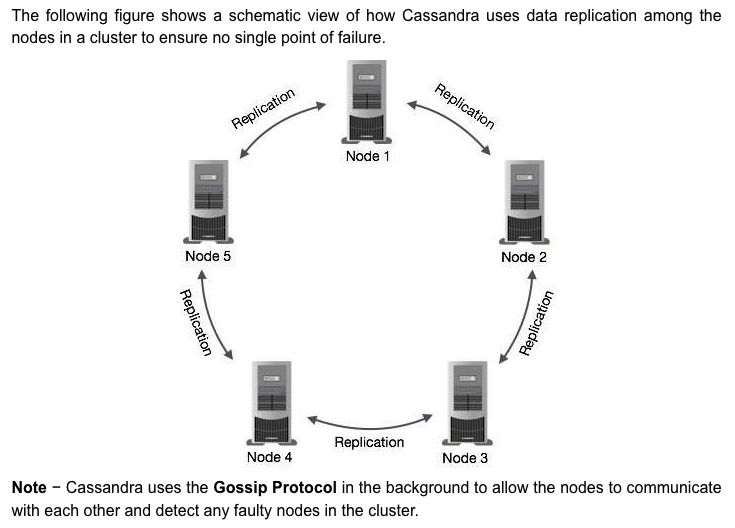
Cassandra uses a peer-to-peer model in a ring topology for replication. Its distribution model is blissfully simple, racks and data-centers. Automated replication across data centers is a popular feature. To be nerdy, very cool.

Source: Intstacluster.com

Your work load should drive your choice. Leader follower is simpler, is easier when strict consistency is required, and with back-up masters is reliable. However, with enough inbound requests, it may bottleneck.

Peer to peer is more complex, is chatty (i.e. requires more internode communication), and prefers eventual consistency. However, this complexity provides dramatic horizontal scalability. For example, a Cassndra deployment ran12,000 commodity servers across many data centers/regions. When deployed properly, you won’t get diminishing returns, it scales linearly.

Problem 4: Reliably process and store data despite one or more node failures.

At scale we coordinate 100s to 1000s of nodes and serve 1,000,000s of customer. Some of them, hopefully only the nodes, will fail, and sometimes many nodes will fail together. So peers, followers, and leaders all need to share or replicate their data to at least one partner, and frequently 3 to 5 partners. This data might be a customer order or the identity of the current leader on the network when one has failed.

Regardless of the distribution style, node failure in an asynchronous system introduces a hard constraint - it is not possible to be 100% available and provide 100% data consistency. Yes, those are strong words. Read the FLP proof here

Given three or more copies of every piece of data, that data values change, and that we can’t instantaneously update all nodes, which nodes have the correct value? And what happens when a node fails? Did only it have the correct value? How would you know? Again, we’ll keep it simple here by discussing only a common conceptual approach, the Paxos algorithm.

The problem is achieving consensus about the correct value of a piece of data at a particular time across multiple nodes when one node can fail. Thankfully, the terminology is straightforward: the nodes must come to a consensus on the correct value, say the value of items in a shopping cart, or perhaps the identity of the current leader.

The lowly log, append only, is often at the center of achieving consensus during replication in this asynchronous world. It has a lot to do with the order in which things happen. But we’ll leave that for another day.

The Paxos algorithm in the abstract is simple. Each participant is a node. A node proposes that the other nodes promise to consider a new value for a shared data element. If a quorum of other nodes promise to consider accepting a new value, then the proposer sends out that value. If a quorum of nodes accepts the new value, then the proposer tells all the nodes to commit the value. And how does each node decide? Well, Paxos is a paper unto itself, so read about it here

Cassandra, S3s indexing solution, and many others use Paxos. Other solutions, like Zookeepers atomic messaging, used by Kafka, Hadoop, etc. exist as well. 

Problem 5: Meet your business needs for data consistency and availability.

The CAP Theorem is important to understand when talking about distributed systems. It is often misunderstood. CAP stands for Consistency, Availability, and Partitioning. Think of partitioning as a failure, a failure of either a node or a network connection. 

The point of the Theorem is that, since we can’t avoid node failure (partitioning) in a distributed system, we must optimize for either consistency or availability. The key word is “optimize.” An AP system can be consistent through failures, but it may take longer than your customer can accept.

CP System - prioritizes consistency over availability/speed, i.e., I’m willing to wait because I need the most current data

AP System - prioritizes availability/speed over consistency, i.e., I’m not willing to wait. Give me what you have now. I’ll deal with it.

If you must guarantee consistency and Availability AP, then don’t use a distributed system as it may fail, but it can remain consistent.

Source: Medium


Thursday, April 7, 2022

Put simply, how does Supervised Learning work?


In Supervised Learning, a program ingests training data as sets of observations, called features, identified using labels. For example, many emails, each labeled Spam or Not Spam.

The program expresses the features mathematically and sends them iteratively into a function. It varies the functions’ governing parameters until getting the desired output. Emails correctly identified as spam or not spam. The program is a machine learning model and the iterative process is called training.

Programs, like people, are not perfect learners. Data scientists and engineers evaluate a model by identifying loss, the number of mistakes made, and variance, how well the model performed across different sets of training data.

Too little loss may cause overfitting where model results are erratic, i.e., have high variance. Too much loss yields more consistent results across data sets, but not accurate enough to be useful.

Data scientists send their programs a lot of data and use a lot of computational resources and time to enable successful machine learning. Sometimes their math enables an accurate model that runs in milliseconds on many data sets, for example, voice recognition on your phone. Sometimes their mathematical approach just fails. Very much a case of “if at first you don’t succeed, try, try again.”

The math and the technology involved are non-trivial. Today’s data scientists stand on the shoulders of centuries of pragmatic mathematicians. Moore’s law and distributed big data together enable the computing scale required.


Friday, March 11, 2022

Shape Up, Agile Method Summary and Commentary


ShapeUp! Shaping, Betting, and Building

The summary starts with the second step in the method, the story flows better this way,

Betting on a six-week release

Key concepts:

  • Product and engineering commit to share and mitigate delivery risk (Fix time/effort and vary scope.)

  • Cross-functional, autonomous teams align to independent technology components, e.g., services, and have end-to-end accountability for feature design, delivery, and production operations.

Phase Overview:

A 6-week release effort is a “bet” matching an “appetite”

An “appetite” is not an estimate. Estimates start with a design and end with a number. Appetites start with a number and end with a design. The appetite is a creative constraint on the design process - to keep it in check, balanced to value.

  1. Language connotes a business risk worth taking - clear customer value at a reasonable price

  2. Needs mutual commitment from tech and product to vary scope and approach to win the bet.

  3. Caps the downside: short enough time to limit the damage if it will cost more than its worth

  4. Provides pressure: long enough time to get something meaningful done and short enough to feel the date pressure

Product shapes the next idea as they support the build process of the current idea.

Shaping

Key concepts:

  • Shape an idea for a customer outcome to design and build in one release.

  • Set boundaries, identify risks, and layout a high-level model, not a design, to be elaborated during the build

  • Pitch the idea to place a bet, i.e., to be chosen to attempt delivery

Phase Overview:
  1. Start with a raw idea - What problem does it solve? And what outcome gives it customer value? How will we verify they get it?

  2. Shape the idea to fit an appetite, apply design thinking, i.e., it may need to be decomposed, list the constraints.

  3. Set boundaries - how much is enough?

  4. Rough out the elements of the idea at a high level, low-fi, but clear on the outcome. Breadth, not depth — explore options. Leave room for designers, e.g., not a UI spec.

  5. Address risks, and rabbit holes by looking for unintended consequences, unanswered questions, etc. Specify the tricky details.

  6. Get technical review and determine what is out of bounds.

  7. Write the pitch:

    1. The problem to solve, along with the expected customer outcome and verifier.

    2. Our Appetite - how much time is it worth and what constraints does that imply?

    3. The core elements of the solution - not the “answer.”

    4. The Rabbit holes to avoid and risks to deal with.

    5. No-gos - what should the team exclude, things we are choosing not to cover to fit the appetite or make the problem workable.

Building

Key concepts:

  • Apply design thinking to balance feature design, technical risk, and time to market.

  • Organize work in the team by application structures (“scopes”) not people. Scopes are independently buildable and testable and may depend on each other.

  • Do the hardest/riskiest thing early

Phase Overview:
  1. Product assigns projects, not tasks, and done = deployed

  2. Hand delivery over to the team to build a feature that gets the outcome given the technology and the time available.

  3. Discover and map the scopes, the independently testable and buildable, end-to-end slices that together make up the feature. Use these scopes, e.g., edit, save, send, to show progress.

  4. Get one piece done, a small end-to-end slice to gain momentum within a few days

  5. Start in the middle, with the most novel, risky element. If time runs short, simplify or remove nice to haves or should-haves.

  6. Substance before style - build and verify basic interactions work before focusing on UI styling

  7. Unexpected tasks and opportunities will appear as you go, so know when to stop.

    1. Compare completed work to a baseline, e.g. the customer experience now, not a future ideal.

    2. Use the mutual commitment of 6 weeks to an all-or-nothing release as a circuit breaker to limit the scope.

Commentary

Top takeaways:

  • Scopes with automated tests speed development and enable the long run product and organizational flexibility that is central to Amazon, Google, Spotify, etc.
  • The “circuit breaker” motivates frequent releases and shared accountability between engineering and product, but may trade-off completeness in the near term.
  • ShapeUp is lightweight and has obvious limits. Say you’ve got 48 people across 8 teams and two years of budget to scale up your software. How do you define and coordinate all of that work? Carefully, I assume.
  • Shape Up heroically assumes autonomous, cross-functional teams. Which I support wholeheartedly, but you may not have.
The concepts are excellent and apply outside this lightweight method. I added the italicized content as it felt implied. I’m guessing most who use it would also sprinkle in some scrum. This approach begs for XP practices. Scopes are natural outcomes of TDD and BDD.

The summary leaves a lot out, e.g., large project how-to guidance. Some of it seemed silly, e.g., visualizing status as scopes rolling up and down hills. But, the content is free; you find it here, and I’m not complaining. The scopes concept is central to software development. In fact, outside of the hill thing, there is little to dislike.

ShapeUp is lightweight and has obvious limits. Say you’ve got 48 people across 8 teams and two years of budget to scale up your software. How do you define and coordinate all of that work? Carefully, I assume. It heroically assumes autonomous, cross-functional teams. Which I support wholeheartedly, but you may not have.

A small consultancy doing web development projects for clients created the method, and it fits that like a glove. It can be a great fit for small tech startups until they scale past two or three teams. After that, keep the concepts and solve the next set of problems. Lots of good toolsets out there, LeSS, Scrum, etc.