Showing posts with label BigData. Show all posts

Friday, July 1, 2022

Machine Learning: what it is, what it's not, and links to go deeper

Cassie Kozyrkov is an Artificial Intelligence (AI) / Machine Learning (ML) expert and evangelist at Google. She published a set of training sessions called Making Friends with Machine Learning on YouTube. They are excellent, all six hours of them. To dive deep, watch them.

This article is a summary of her introduction to Machine Learning presentation. 

To get a flavor for her style, lets contrast Wikipedia’s definition of ML with hers. “Machine learning is a field of inquiry devoted to understanding and building methods that ‘learn,’ that is, methods that leverage data to improve performance on some set of tasks.” Vs.  “Thing labeling with examples and truth-finding.”  She expresses complexity with simplicity.

Machine learning is an approach to having computers make an enormous number of small decisions.

  • It is fundamentally different from traditional computer programming
  • Artificial intelligence succeeds at very complicated tasks that programmers can’t write instructions for by hand
  • Think of it as automating the ineffable
Let’s compare the two approaches.

A traditional computer program accepts information input and processes it via statements executed in sequential, conditional, or iterative order. The program’s code is a human readable collection of statements, structures, and algorithms that automate a process. More simply, it is a human readable recipe for solving a problem.

In contrast, machine learning uses a lot of raw data and sophisticated math to generate algorithms. The implementation details of all of this are beyond human comprehension at anything but an abstract or theoretical level. They are beyond our comprehension because of the sheer volume of equations and because of their use of dimensions beyond length, width, depth, and time. We humans cannot practically problem solve in over four dimensions. But with computer automation, our math can.

Data Scientists and Engineers don’t code the generative algorithms, they select them from a finite number invented by researchers, for example Neural Networks, Random Forests, or Logistic Regression. They feed the generative algorithms mountains of data and consume enormous amounts of compute resources to generate the Machine Learning algorithms, called models, that are the computer programs they “train.”

Data Scientists and engineers train their Machine Learning models by providing huge data sets of labeled examples to the researchers’ generative algorithms. Here’s the general structure of the data:

  1. An “instance” is an example a.k.a. an observation; a row in a spreadsheet.
  2. A “label” is the answer, a.k.a. the target, the output, or the ideal output, for the example.
  3. A “feature” is something we know about the example a.k.a. a variable, a column of a spreadsheet.

The algorithms iterate over the instances, evaluating their features, trying an astronomically high number of variations until they, maybe, learn to discern the correct labels for not only their training data but also for data they have never seen, i.e., they didn’t train on. For example, the ability to recognize the sound of the words “hello there” spoken by 100 million unique voices.

More formally then, Machine Learning is an approach to making or computing many small decisions that involve algorithmically finding patterns in data and using these to make recipes that deal correctly with brand new data.

Machine Learning was first realized in code in 1952, and its theoretical birth, the invention of the neural network, occurred in 1949. But it only took off when compute and storage resources became fast enough and large enough to handle the massive processing requirements needed to generate useful models.

Despite the illusion created by talking to Alexa or Siri, the Machine Learning models we use daily are not conscious or ”alive” in any meaningful sense. Humans are required throughout. We curate the enormous labeled data sets of examples. We select and try many models. We verify the results. Over time even our successful models are imperfect and require additional human intervention to identify emergent mistakes and then regenerate the models to maintain their accuracy. If you are its owner, think of an ML model as a high-interest credit card that is never fully paid back.

Cassie's view is that the biggest problem in AI is using all the right math to answer the wrong question. “We must ask the right questions and solve the right problems. Machine learning will optimize whatever we give it. Give it the wrong thing and you’re in big trouble. Much like the genie in the lamp, the genie is not the problem; it is the wisher. And the wisher does not have to be malign. They can just be foolish and not think through the likely outcomes of their choice.”

The type of label needed drives the high level approach to machine learning: classification or prediction. 

  1. Binary classification: image recognition - cat/not cat.
  2. Multi-class: image recognition of a cat, dog, or weasel.
  3. Prediction of a numerical outcome $12.14, 10.67, etc.

Types of machine learning:

  1. Supervised learning: for any example you give the system, you have the correct label handy. Keywords: labeled data.
  2. Unsupervised learning is the search for patterns. You have data but no labels. Keywords: data mining and clustering.
  3. Semi-supervised learning is the blend of supervised and unsupervised where we have some, but not all, data labeled. Keyword: partial guidance.
  4. Reinforcement learning. Here, the system takes a sequence of actions towards a goal that leads to success or failure. For example, learning to play a game. Keywords: sequence of actions, reward/punishment, delayed feedback, system influences its environment (and inputs).

Cassie points out that reinforcement learning is really, really hard. It rarely works, but when it does its magic. Think of self driving cars. Their modeling is based on game algorithms.

So how do you know if machine learning might be a fit for your problem? We’ve already covered that the problem should be ineffable, meaning it’s not practical for a programmer to write code to solve it. The next question is: can you imagine what sort of decisions or labels would the machine learning system make for you? If you cannot answer that question, then stop. It’s too early. You’ll need to derive insight by analyzing the problem space using descriptive analytics first. 

Which brings us to a basic process description of Data Science:

  1. Use descriptive analytics to get inspired and discover a problem machine learning may solve for you. 
  2. Problem in hand, use machine learning to generate a recipe, i.e., use technology to create the model. 
  3. Test the efficacy of the model using statistics. Remember the Genie; decide wisely.

Links to Cassie’s videos:

  1. http://bit.ly/mfml_part1
  2. http://bit.ly/mfml_part2
  3. http://bit.ly/mfml_part3

Link to Cassie on Medium: https://medium.com/@kozyrkov

Thursday, April 21, 2022

5 Problems Big Data Architectures Solve


The breadth of Big Data and Analytics technical architecture can seem intimidating. Despite its diversity, though, it solves a handful of problems. It makes trade-offs and surprise, just moves work around to meet its performance goals.

I’ll attempt to describe the key problems and the tradeoffs simply. These basics should help demystify architecture selection and troubleshooting for technology leaders new to the space.

Big Data is well, big. Too big for one machine to process quickly and store reliably. So, we need a lot of machines, working in parallel, and will have to coordinate their activity. How many? In the extreme, thousands.

Data may stream in so fast that it is hard to even ingest it without falling behind. With so much distributed data, finding and reading it quickly becomes a problem. Finally, reliable storage requires multiple copies and reliable coordination requires a way to handle coordinator failure.

In short, the problems are to:

1. Scale write, read, and processing performance

2. Parallelize work across nodes, i.e., machines.

3. Efficiently share data and coordinate activity across nodes.

4. Reliably process and store data despite one or more node failures.

5. Meet your business needs for data consistency and availability.

Problem 1: Scale write, read, and processing performance.

Writing

At scale, simple things like reading and writing become hard. The physical world is unforgiving, so learn your constraints. You can’t have it all. Ultra fast writes typically means slower reads and vice versa. When you can solve for both, accept that you’ll create a new problem. There are no free lunches at scale.

In a nutshell, store your data in ways that make it easy to do what you need to do with it. And address the consequences. Let’s look at some examples.

A traditional transactional database needs data consistency, so its relational model limits data redundancy. It needs reasonably fast reads and writes, so it defers some of its disc housekeeping, index and other storage optimization to off hours. Just don’t forget to schedule it!

Specifically, most Relational Databases record where they store their data on disc in real time using B+ Trees. Each file write causes multiple updates to the B+ Tree and takes time. To avoid more delay, it writes data somewhat haphazardly to disc blocks, slowing reads. The deferred work moves to clean up jobs. 

Source: Wikipedia

What if we need faster writes? Well, something has to give. Cassandra, for example, provides faster writes, strong read times, and lightweight transactions. The cost is more data redundancy and less consistency. You also have to agree to less flexible read options — sorts move from query parameter to design decision. But wow, very fast.

To do this, Cassandra, and others, e.g. Kafka, use a Log Structured Merge Tree. Writes are batched based on available RAM (memtables) and appended to a log (SSTables). Deletes and modifications are appended to the log rather than applied to the underlying data store. A compaction process handles data storage changes and optimizations, again in batches.

Source: Creative Coder

These are two common options. There are other optimization strategies that trade off various constraints.

Reading

Let’s stick with the familiar. A traditional relational database, Oracle, SQL Server, DB2, is row oriented, i.e., stores rows together in files on a drive. Rows offer a good fit for transactional use cases, lots of fine grained, surgical inserts, modifications, etc., and AVRO is a common file format. However, analytical use-cases frequently aggregate one column of data from thousands of rows and thus must read more than they need.

The heuristic is to store data the way you want to use it. Analytical use cases benefit from column oriented file structures, like Parquet. They read only what they need to and, given their columns, have homogenous data; so they compress to save storage space.

As always, there is a tradeoff: writes are slower. In fancy language, these structures are great for write once read many workloads. Column database examples, Redshift and HBASE.

Source: datacadamia.com

Yes, there are hybrids. Cassandra and BigTable can save a set of columns (a family), whose data is frequently used together.

You may also optimize for data access granularity. If you need to process large grained objects (files) one by one, then an object storage solution like AWSs S3 fits the bill. It uses a key-value pair where the value is the object, e.g. BLOB, Json file, etc. If you need fine grain access to groups of structured data elements, then consider a low-latency, high consistency, key-value/document database solution like AWSs DyanmoDB.

Note the storage types below. It fits this discussion well, but I’ll hand wave it and just provide a link so if you don’t already know, you can learn more about them. 


Source: Cloudain.com

Problem 2: Parallelize work across nodes, i.e., machines.

Since one machine, node, can’t do the work quickly enough, we must parallelize it. We need to abstract away the complexity of dealing with all the different nodes so the developer can focus on the business problem. Map Reduce is one such solution. How it abstracts away the complexity we’ll ignore and simply look at its workflow, which is basic.

Map Reduce does something simple. It collects some data and maps it into a structure, say sales for the week. And then reduces it into something useful, say the min, max, and average sale volumes for the week. The developer writes the logic for the job and the Map Reduce application finds the nodes with the data and runs the logic on each machine in parallel, and then stores it.

Source: Hadoop In Practice

While good for simple tasks, the Map Reduce framework causes a developer to create a lot of jobs and knit them together. Imagine quarter-end reporting as a long list of jobs. At Big Data scale, that is difficult to manage. As we’ll see, this is a solved problem.

Big Data Analytics require complex online analytical processing requires inner joins, outer joins, etc. Frameworks like Tez, HIVE abstract away that NoSQL/SQL complexity using algorithms expressed and coordinated via Directed Acyclic Graphs (DAGs). These graphs flow work from left to right and do not loop.

Source: Medium

DAGs are expressive and easy to use and have become a de facto developer standard for expressing simple and complex workflows, i.e., they are not just powering low level frameworks. Examples include Spark, Beam, Airflow, Kubeflow, and ML pipelines…

ML uses interesting graphs. Feed-forward Neural Networks traverse a graph in one direction, have layers, and evaluate loss at the points where layer nodes meet. Convolutional Neural Networks, and others, use bi-directional traversal, to enable Gradient Descent and Backpropagation.

Source: Brilliant.org 

Problem 3: Efficiently share data and coordinate activity across many nodes.


Many machines working in parallel mean many logical and physical boundaries to cross, process, user space, system space, network, and storage mediums, etc. Given speed is a goal, boundaries are a toll, they take time to cross.


Process as much data locally as is practical, I.e. minimize the amount of data passed across the network, processes, or storage boundaries on a node to reduce latency. As mentioned earlier, Map Reduce handles some of this heavy lifting. However, remember it passes data across jobs by persisting it.


As an example, in the Hadoop ecosystem, YARN applications may keep nodes (VMs) active across jobs to keep data in memory for a subsequent workflow step and to avoid VM startup times. The tradeoff is inactive VMs consume memory and may starve others. And there are other examples, Spark uses Resilient Distributed Datasets (RDDs) as a form of shared memory.

Source: tutorialspoint.com

Stating the obvious in distributed systems, avoid workflows that allow hosts to block each other’s tasks, and prefer asynchronous vs synchronous cross node communication. Onto coordination.

Coordination

Coordination happens at multiple levels. We'll keep it simple. Let’s define “coordinate” to mean managing work across nodes. The next section will address failures.

Continuing to use the Hadoop example, let’s look at the “abstracted complexity” that allows developers to not worry about work distribution. There are three layers:

1. YARN (Yet Another Resource Manager) - yep, manages applications, handles some scheduling.

2. MapReduce - organizes where mapper and reducer work will happen (runs in YARN as of Hadoop 2).

3. HDFS - Hadoop Distributed File System - determines where data goes where it is.

Source: Hadoop In Practice

The above diagram highlights a common coordination model, master/slave, or leader/follower, if you prefer. Here, the leader is the authoritative source of what data is “correct” and which node should do what and when. Leader/follower relies on an primary/backup data replication model. A set of changes comes in, let’s say to add a value, and then update it three times. The leader will apply those changes and send the final value to its followers. This can create a single point of failure, so often a backup master who is aware of all the changes. As long as both of them don’t fail at once, all is well. Over two masters? Then there are some overlaps with peer-to-peer. 

In centralized distributed computing, leader/follower and peer-to-peer are the main options.

In peer-to-peer, any node can be a leader or a follower; all nodes have the same capabilities and their function, leader or follower, is context dependent. Here, the data replication model is state machine based. While there is a leader, it shares all incoming changes with the other nodes in its cluster so that anyone of them can become the leader if the current leader fails. 

Source: The Log: What every software engineer should know
Source: Tutorialspoint.com

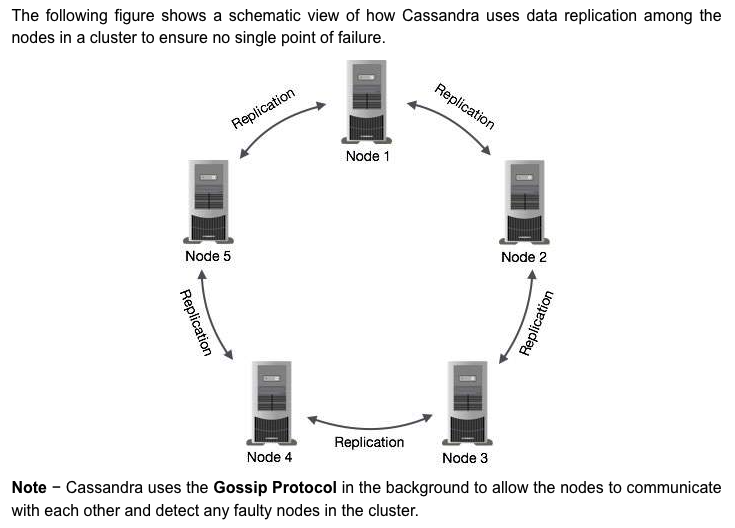
Cassandra uses a peer-to-peer model in a ring topology for replication. Its distribution model is blissfully simple, racks and data-centers. Automated replication across data centers is a popular feature. To be nerdy, very cool.

Source: Intstacluster.com

Your work load should drive your choice. Leader follower is simpler, is easier when strict consistency is required, and with back-up masters is reliable. However, with enough inbound requests, it may bottleneck.

Peer to peer is more complex, is chatty (i.e. requires more internode communication), and prefers eventual consistency. However, this complexity provides dramatic horizontal scalability. For example, a Cassndra deployment ran12,000 commodity servers across many data centers/regions. When deployed properly, you won’t get diminishing returns, it scales linearly.

Problem 4: Reliably process and store data despite one or more node failures.

At scale we coordinate 100s to 1000s of nodes and serve 1,000,000s of customer. Some of them, hopefully only the nodes, will fail, and sometimes many nodes will fail together. So peers, followers, and leaders all need to share or replicate their data to at least one partner, and frequently 3 to 5 partners. This data might be a customer order or the identity of the current leader on the network when one has failed.

Regardless of the distribution style, node failure in an asynchronous system introduces a hard constraint - it is not possible to be 100% available and provide 100% data consistency. Yes, those are strong words. Read the FLP proof here. 

Given three or more copies of every piece of data, that data values change, and that we can’t instantaneously update all nodes, which nodes have the correct value? And what happens when a node fails? Did only it have the correct value? How would you know? Again, we’ll keep it simple here by discussing only a common conceptual approach, the Paxos algorithm.

The problem is achieving consensus about the correct value of a piece of data at a particular time across multiple nodes when one node can fail. Thankfully, the terminology is straightforward: the nodes must come to a consensus on the correct value, say the value of items in a shopping cart, or perhaps the identity of the current leader.

The lowly log, append only, is often at the center of achieving consensus during replication in this asynchronous world. It has a lot to do with the order in which things happen. But we’ll leave that for another day.

The Paxos algorithm in the abstract is simple. Each participant is a node. A node proposes that the other nodes promise to consider a new value for a shared data element. If a quorum of other nodes promise to consider accepting a new value, then the proposer sends out that value. If a quorum of nodes accepts the new value, then the proposer tells all the nodes to commit the value. And how does each node decide? Well, Paxos is a paper unto itself, so read about it here. 

Cassandra, S3s indexing solution, and many others use Paxos. Other solutions, like Zookeepers atomic messaging, used by Kafka, Hadoop, etc. exist as well. 

Problem 5: Meet your business needs for data consistency and availability.

The CAP Theorem is important to understand when talking about distributed systems. It is often misunderstood. CAP stands for Consistency, Availability, and Partitioning. Think of partitioning as a failure, a failure of either a node or a network connection. 

The point of the Theorem is that, since we can’t avoid node failure (partitioning) in a distributed system, we must optimize for either consistency or availability. The key word is “optimize.” An AP system can be consistent through failures, but it may take longer than your customer can accept.

CP System - prioritizes consistency over availability/speed, i.e., I’m willing to wait because I need the most current data

AP System - prioritizes availability/speed over consistency, i.e., I’m not willing to wait. Give me what you have now. I’ll deal with it.

If you must guarantee consistency and Availability AP, then don’t use a distributed system as it may fail, but it can remain consistent.

Source: Medium


Thursday, April 7, 2022

Put simply, how does Supervised Learning work?


In Supervised Learning, a program ingests training data as sets of observations, called features, identified using labels. For example, many emails, each labeled Spam or Not Spam.

The program expresses the features mathematically and sends them iteratively into a function. It varies the functions’ governing parameters until getting the desired output. Emails correctly identified as spam or not spam. The program is a machine learning model and the iterative process is called training.

Programs, like people, are not perfect learners. Data scientists and engineers evaluate a model by identifying loss, the number of mistakes made, and variance, how well the model performed across different sets of training data.

Too little loss may cause overfitting where model results are erratic, i.e., have high variance. Too much loss yields more consistent results across data sets, but not accurate enough to be useful.

Data scientists send their programs a lot of data and use a lot of computational resources and time to enable successful machine learning. Sometimes their math enables an accurate model that runs in milliseconds on many data sets, for example, voice recognition on your phone. Sometimes their mathematical approach just fails. Very much a case of “if at first you don’t succeed, try, try again.”

The math and the technology involved are non-trivial. Today’s data scientists stand on the shoulders of centuries of pragmatic mathematicians. Moore’s law and distributed big data together enable the computing scale required.


Thursday, December 8, 2016

Big Data Technology Impacts of NoSQL, Distributed Data Stores...

The last 30 years have brought dramatic change to the world and technology.  Moore's law and the internet's relentless march connect more devices than there are people on the planet. Cisco estimates 50 billion connected devices by 2020.  To many cloud computing, big data and NoSQL tools sit hidden behind Facebook, Google and ubiquitous smart phone apps . Even those in IT may sometimes struggle to synthesize these innovations.

In this post we'll take a brief look at the implications of some of these changes on traditional business intelligence and analytic capabilities. Think of this as a quick survey of the landscape and not a deep dive into its many facets. Let's start with a seemingly esoteric NoSQL capability: graph processing and databases.

Graph Processing and Databases

We benefit from graph technology every day. Let's look at a visualization and some use cases.


Real time recommendations on retail web sites, the sometimes creepy "friend recommendations"  on Facebook.  Both echo chamber and gold mine: social network analytics for marketing and advertising. GPS applications like Waze or google maps. A little less obvious are use cases like network and operations root cause analysis, contextualizing real time streams of event and other data from the internet of things' sensors. Finally, saving money and sometimes lives via fraud detection, cybersecurity, and medical research.

When the relationships of things to each other are as important as the things themselves - graphs are attractive. Beyond the ubiquity of this hidden technology notice that unlike traditional BI and analytics for some key use cases, e.g. recommendations, identity and access management, it can be real time.

Before we move on to look at NoSQL more generally, it's important to recognize a few things about graph processing and graph databases. Graph databases often compete as OLTP tools e.g. Neo4j. Large scale graph processing is more an OLAP capability e.g. Giraph, Pregel, so the graph's data may sit in another NoSQL distributed data store. Having said that, the intuitive nature of the graph database lends itself to OLAP.

Depending on the scale and type of the analysis graph queries using languages like cypher or gremlin are often dramatically simpler to write than similar queries in SQL. Also, queries across many layers of related things perform orders of magnitude faster in a graph database than in a relational database.

Before we go any farther we'll need to have at least a passing understand of how NoSQL enables big data.

NoSQL - A Quick Overview

What's happened to the "relational" world? Data warehouse data marts and multi-dimensional cubes for OLAP, along with SAS, once ruled the BI and data analysis landscape.  Yet open sourced projects like R, Hadoop, Cassandra, Spark are in the forefront of the now "big" data world.  Even SQL database OLTP dominance may be challenged by the modern graph databases like Neo4j's ACID support, ease of use, and lightening speed for some use cases. 

NoSQL - could anyone have picked a worse or more misleading name? Every major cloud provider offers SQL based API's to many of their "noSQL" data sources.  SQL tends to connote relational data stores and tables. Yet,  graph databases are intrinsically relational and the open sourced versions of google's distributed, non-relational data store (now categorized as Column based noSQL) is called BigTable/MapReduce. Oh well, at least Column based noSQL is not really tabular.

NoSQL type characteristics overlap suggesting innovation will continue. My advise is to think "not only SQL" when you think of NoSQL.

Wikipedia's current taxonomy of relevant types of NoSQL along with example implementations.
  • Column: Cassandra, HBase
    • This type is often part of a distributed data store which has many benefits beyond the scope of this conversation. For now we'll just say it allows reliable, fast querying agains huge amounts of data across many computers, or nodes, at once
    • Map Reduce often handles querying where "map" sorts and filters and "reduce" summarizes.  Other common query tools include Hive and Pig
    • A column of a distributed data store is its lowest level object. It is a tuple (a key-value pair) consisting of three elements: A unique name, a value (or set of values), and a time stamp to determine if the content is valid or stale.
    • Example columns: 
      • street: {name: "street", value: "1234 x street", timestamp: 123456789},
      • city: {name: "city", value: "san francisco", timestamp: 123456789}
    • This data often resides on a Hadoop filesystem and may be performance optimized via Spark
  • Graph: Neo4J, Apache Giraph, MarkLogic
    • Graph databases uses nodes which represent entities like person, edges which represent relationships, and Properties which can be associated with both nodes and edges
    • Working with graph databases is generally intuitive as the storage model directly reflects natural language rather than being burdened with the physical implementation details of most other data stores e.g. relational or column
    • Relational databases use keys to relate entities to one another leading to "joining" one to many tables. Graph databases use pointers to relate one entity to another and may capture properties about the relationship.  The deeper the levels of relationships the more this database differentiates itself from relational stores.
    • Compared with relational databases, graph databases are often faster for associative i.e. highly related, data sets and map more directly to the structure of object-oriented applications. They can scale more naturally to large data sets as they do not typically require expensive join operations. As they depend less on a rigid schema, they are more suitable to manage ad hoc and changing data with evolving schemas. 
    • Conversely, relational databases are typically faster at performing the same operation on large numbers of data elements.
  • Multi-model: MarkLogic, OrientDB
    • Supports multiple data models against a single, integrated backend. Document, graph, relational, and key-value models are examples of data models that may be supported by a multi-model database.
    • An article by Martin Fowler suggests this type will become more prevalent over time Polyglot Persistence
  • Document: MarkLogic, MongoDB
    • A document-oriented database, or document store, is designed for storing, retrieving, and managing document-oriented information
    • Graph databases are similar, but add another layer, the relationship, which allows them to link documents for rapid traversal.
  • Key-Value: Redis, Oracle NoSQL
    • Manages data in associative arrays, a data structure more commonly known today as a dictionary or hash. 
    • Dictionaries contain a collection of objects, or records, which in turn have many different fields within them, each containing data. These records are stored and retrieved using a key that uniquely identifies the record, and is used to quickly find the data within the database.
    • Very easy for developers to use e.g. to persist objects.  Computationally powerful for some use cases. Some graph databases underlying implementations are key-value store.

Dealing with the Big in Big Data

A simple example:
Let's take a simple comparison: doing analysis of invoices versus sensor data from the internet of things. Traditionally for invoices you might extract the invoice data from your transactional data store, transform it into dimensions and facts, load it into your data mart to run reports or do sophisticated analysis by loading it into a cube. For gigabytes of data this works great (if requiring a lot of money to set up - more on that in a minute). 

Sensor data sets are often much, much larger, think terabytes. Yet, we can simplify and say the data has many dimensions (e.g. time, sensor type) and sensor readings (facts) to assess.  Using ETL to create a data mart is impractical. Enter "big data" with its distributed data stores and analytic capabilities.

Let's take a more accessible, if over simplified, example than sensor data. Perhaps Macy's wants to do analysis of the last 50 years of sales invoices.  Rather than put all of that data into a data mart they might leverage the distributed computing power of Hadoop and MapReduce. They could create a text file for each invoice and then distribute the invoices across many data stores in the cloud. Next they'd leverage MapReduce to do their summarizations across many computers in parallel.

Turns out this processing can be done very quickly. Programming is involved but a no where near the cost of using a more traditional approach. The aggregations etc. that this processing does can then be fed into a tool like SAS (or R) to do more in-depth, ad-hoc analytics. 

Getting more granular:
The term "text file" above could use some expansion. These could be realized as NoSQL columns, hive "tables" etc.  Hive is a great example of why we might choose "not only SQL" as the expansion of the term NoSQL. It exposes a SQL API to interact with virtual tables.  

As the complexity of the problem solved grows so does its implementation details. For example, designing the structure of an HBASE database is non-trivial.  

In the simple example above we say the outputs of MapReduce can then be input to a tool like SAS for ad-hoc querying.  Apache SPARK enables Hive to present users complex, OLAP style ad-hoc query capabilities agains huge distributed data stores. 

Spark creates a flexible abstraction called the "resilient distributed dataset" that aggregates data across many computers in a cluster. This aggregation overcomes MapReduce's limitation of requiring a linear data flow where you map a function across data and then reduce the results onto disk. It overcomes this limit by creating shared memory across the computers in the cluster enabling iterative passes over the data. Put more simply, it brings OLAP (and machine learning capabilities) to cloud tools including Hadoop's HDFS, Cassandra, Amazon S3, Open Stack's Swift...

However, Spark also necessitates additional complexity such as the use of cluster managers. It has its own native manager as well as provides support for Apache Mesos and Hadoop YARN.  Once again we see google innovation at work. Mesos conceptually descends from google's omega scheduler. It has used Omega to manage its services at scale. We'll stop here as cluster managers are a topic onto themselves.

Finishing up

This post summarizes a huge space in a few pages. I hope you found it useful. I've tried to describe a very complicated space in a simple manner.  If I've misrepresented rather than simplified, please comment so I might update this post.

So we started big lets end big.  Facebook's network of friends has caused it to be a pioneer in the graph processing. They have scaled graph processing up to handle a trillion edges ie. relations! Read about that here.  Here's a visual of their conceptual architecture.


Monday, December 5, 2016

Big Data Business Intelligence and Visualization 2016

Early in my career at Accenture I spent a lot of time consulting in Enterprise Information Management or more specifically: Content Management and Publishing (IA), Data Strategy and Governance, and bit in BI.  After spending some years in mostly Agile, OLTP, and SOA, job opportunities present themselves that have me looking into the space again. This post is the first of a few on developments here. This one looks at Gartner's 2016 vendor POV and some self-service Data Visualization vendors.

With the advent of big data technologies like Hadoop, Map Reduce, Spark, Graph DB's, Neo4J, Pregel... ....data visualization, multi-dimensional networks, IOT and cloud this space is ripe with opportunity. Gartner's 2016 Magic Quadrant for Business Intelligence and Analytics Platforms illustrates some of this. They have fundamentally retooled how they look at the space.

Gartner's view is generally: 


  1. The market is moving from centralized IT BI capability delivery to decentralized self-service business capabilities often baked into business processes. Business self-service data preparation and analysis is a good example. 
  2. From a technology perspective: "By 2018, smart, governed, Hadoop-based, search-based and visual-based data discovery will converge in a single form of next-generation data discovery that will include self-service data preparation and natural-language generation."
  3. The vendor market is fragmented. Trying to rely on one big vendor will likely not meet all of your needs. In the near term businesses should assess their needs and find the products that match them.

Gartner's five use cases reflect this view:


  1. Agile Centralized BI Provisioning
  2. Decentralized Analytics
  3. Governed Data Discovery
  4. Embedded BI
  5. Extranet Deployment
Before we look at the Magic Quadrant let's look at overall vendor group's performance against Gartner's 2016 "Critical Capabilities for Business Intelligence and Analytics Platforms" publication. It is interesting that the rankings, using a 1-5 scale, on average are not that good. I am not sure if this is a common occurrence in their assessment methodology. The rankings may simply reflect market conditions.

The group's only "excellent" capability average comes in "BI Platform Administration." Looks like cloud may be helping to level the playing field a bit for new entrants.  

The overall vendor results are similarly mixed:
Gartner provides customer reviews of many of these vendors here.

Gartner Magic Quadrant


Note that the Leaders rank only "fair" on average across Gartner's 14 critical capabilities.  Of those with an average rank of "good" most are in the Visionary quadrant and 45% in Niche.  Our deep pocket product vendors are mostly average "fair" as well. Interesting market right now.

Something to consider: What do you really want? 

Gartner assessment criteria are somewhat conservative focusing as much on vendor stability, size etc. as on the quality of the underlying product implementation.  To some extent that unmeasured quality  characteristic dictates the vendor's  ability to innovate and deliver capability differentiation. This suggests Gartner may be a poor guide if you are after differentiation. For example,  graph processing and databases as well as graph based analytics delivered via Cloud shows promise. Look at what Facebook, Ebay, AWS and Google have been up to. More on this in a future post. Another example is in the Data Visualization space. Let's take a quick look there now.

Data Visualization Product Landscape


Data Visualization is key to modern Analytics. Roughly half of the top products made the Gartner list. Again - makes sense given Gartner's assessment criteria - but it sure seems there is opportunity out there to leverage!


Additional References

Here is link to the google sheet used to do the analysis above. It has a bit more data and links to more as well.