Metrics and Management Reporting
Kanban’s continuous-flow system means that we are less interested in reporting on whether a project is “on-time” or whether a specific plan is being followed. What’s important is to show: that the Kanban system is predictable and is operating as designed, that the organization exhibits business agility, that there is a focus on flow, and that there is clear development of continuous improvement.
For predictability, we want to show how well we perform against the class-of-service promises. Are work items being treated appropriately, and, if the class of service has a target lead time, how well are we performing against that? What is the due-date performance?
For each of our indicators, we want to track the trend over time, so we can see the spread of variation. If we are to demonstrate continuous improvement, we want the mean trend to improve over time. If we are to demonstrate improved predictability, we want the spread of variation to decrease and the due-date performance to increase.
Track WIP / Cumulative Flow
Are we managing work-in-progress? Cumulative Flow Diagrams show us how well our kanban system is running. Bands should be smooth with stable heights and item counts should fit established ranges. Reading horizontally gives us average lead time.

Lead Time
Do we consistently meet our class of service promises, are we predictable?

Spectral analysis (figure 12.2) is more revealing than averages as it shows outliers and how often we "barely made it." Averages are useful for general trends.

In the example shown in Figure 12.4, it would make sense to investigate the root causes of the cluster of items that just failed to meet the target. If these root causes could be addressed, the Due Date Performance (percentage of items delivered as expected) should improve.

Due Date Performance
It's typical to report for past month, quarter and year (see figure 12.4). Since fixed date items are often estimated they should include a forecast actual comparison.
Throughput
How much work are we getting done each reporting period? Trend over time while monitoring for continuous improvement.
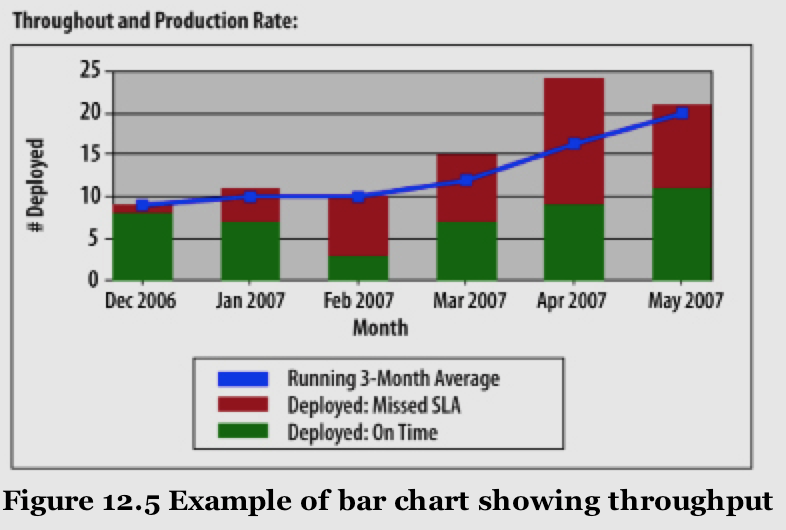
Throughput is similar to Agile velocity. Units are often story points or user stories. More traditional units are use cases, change requests, and function points. Ideally, we report business value delivered.
Throughput data is used in Kanban for an entirely different purpose than velocity in a typical Agile development environment. Throughput is not used to predict the quantity of delivery in a time interval or any specific delivery commitment. Throughput is used as an indicator of how well the system (the team and organization) is performing and to demonstrate continuous improvement. Commitments in Kanban are made against lead time and target delivery dates. Throughput may be used on larger projects to indicate the approximate time to completion with appropriate buffering for variation.
Issues and Blocked Work Items
This chart gives us an indication of how well the organization is at identifying, reporting, and managing blocking issues and their impact. If Due Date Performance is poor, there should be corresponding evidence in this chart demonstrating that a lot of impediments were discovered and were not resolved quickly enough. This chart can be used on a day-to-day basis to alert senior management of impediments and their impact. It also can be used as a long-term report card to indicate how capable the organization is at resolving impediments and keeping things flowing— a measure of capability in issue management and resolution.

Flow Efficiency
Lean manufacturing measures flow efficiency as the ratio of lead time to touch time or the time someone is touching a job. This is harder to measure in software ore thought work. Yet, most tools allow us to easily track lead time to assigned time which is a reasonable proxy. While not an accurate indication of waste nor a useful metric day to day, it can help us see improvement over time. In thought work like software development initial ratios of 10:1 are common.

Initial Quality

Defects represent opportunity cost and affect the lead time and throughput of the Kanban system. It makes sense to report the number of escaped defects as a percentage against the total WIP and throughput. Over time, we want to see the defect rate fall to close to zero, as shown in Figure 12.8.
Failure Load
Failure load tracks how many work items we process because of earlier poor quality— how many work items are production defects or new features that have been requested through our customer-service organization because of poor usability or a failure to anticipate user needs properly. Ideally, failure load should fall over time. This is a good indicator that we are improving as a whole organization and thinking at a system level.
Scaling Kanban to Significant Projects
Many requirements have to be released together. It will be some considerable number of months before a first delivery is made. The team size is larger. There might be lots of work happening in parallel. Significant pieces of work may need to be integrated. Not all of this work will be software development. For example, documentation and package design may need to be integrated with the final software build before a release can be made.
So how do we deal with these challenges?
The answer is to look to first principles. The first principles of Kanban are to limit work-in-progress and to pull work using a visual signaling system. Beyond that, we look to Lean principles, Agile principles, and the workflow and process that are already in place as our starting position. So we want to limit WIP, use visual controls and signaling, and pull work only when there is capacity to do so; but we also want small batch transfers, to prioritize by value, manage risk, make progress with imperfect information, build a high-trust culture, and respond quickly and gracefully to changes that arrive during the project.
With a large project, just as with a maintenance initiative, you will need to agree on a prioritization cadence for input queue replenishment. The general rule is that a higher cadence with more frequent meetings is better. Look at the principles again. What are the transaction and coordination costs of sitting down with the marketing team or business owners and agreeing on the next items to queue for development? At the other end of the value stream, you will have several integration or synchronization points building toward a release rather than a single release point. So, again from first principles, look at the transaction and coordination costs of any integration or synchronization and agree on a cadence. Again, more often is better. Ask the question, “What is involved in meeting with the business to demo recent work and then integrate it so that it is ‘release ready’?”
Next, you will want to agree on WIP limits; the principles for thinking about this do not change. Classes of service will still make sense and help you to cope gracefully with changes during the project.
Hierarchical Requirements (Work Item Granularity)
Project requirements are often three levels deep. Examples:
- Epic, story, task
- Features, feature sets (or activities) and subject areas (FDD)
- Customer requirement, product requirement, functional or non-functional specification
Kanban teams typically manage the two higher levels in their kanban system and not the lowest level. The lowest level focused on effort and activity, is typically handled by individuals as it doesn't aid value stream or performance measurement.
The highest level requirements typically describe some atomic unit of value recognized by a market or customer. Some in the kanban community use the term Minimum Marketable Feature or MMF for these coarse-grained chunks of value. Definitions of MMF vary in the industry. David prefers Minimum Marketable Release or MMR as frequently a large project's features are released in coherent sets rather than independently. The first MMF is typically large, often three orders of magnitude larger, while later features may be much smaller.
The granularity challenge:
- Big differences in work item sizes in kanban need large buffers and high WIP to smooth flow.
- Without large buffers and high WIP, lead time varies dramatically.
- With them, we get long lead times, lower quality via high WIP, lack of business agility. and generally low trust.
- In this situation, we can't achieve the benefits of meeting service levels. We can't frequently and consistently complete work.
Kanban requirement management solution:
- Use a coarse-grained, marketable work item type as the top level requirement e.g. epic, customer requirement
- Use analysis techniques that produce a fine-grained work item type for the second tier requirement e.g user story, functional requirement
- Fine-grained items:
- should have relatively small variations in size.
- ideal size is in the range of a half-day to four days or so of engineering effort.
By adopting this two-tiered approach, we have decoupled the delivery of value from the variability of the size and effort required to deliver that value.
Kanban delivery guidelines:
- Set WIP limits for both item types
- Use a Minimal Marketable Release (MMR) to trigger a delivery
- Assign a cross-functional team to each coarse grained item
- Each cross-functional team pulls the fine-grained work items across the board, without handoffs, to ready to be integrated or released
Two Tiered Card Walls with Swim Lanes
In Figure 13.2, the higher-level requirements, shown with green tickets, flow through a set of states— backlog, proposed, active, resolved, and closed. The active, coarse-grained requirements in green are vertically stacked to the center left. From each of those green tickets extends a swim lane that is divided into the same set of states as for the finer-grained yellow features.

The number of swim lanes is the WIP limit for the coarse-grained customer-marketable requirements, while the WIP limit for the finer-grained features can be set for each swim lane if the individual teams choose to do so. The column immediately to the right of the vertical stack of green requirements contains the names of the permanently assigned team members. The small orange tickets attached to yellow tickets actually contain the names of specialist floating resources, such as user-experience designers and database architects.
We are managing customer-marketable WIP vertically, while we are managing WIP on the low-variability features horizontally. This format proved to be very popular and has become typical.
Incorporating classes of service:
- Large projects often track three work item attributes, hierarchy level, work-item type, and class of service
- Use might use colors, lanes, an icon or sticker to differentiate
- Most organizations have found that overloading any mechanism is acceptable as long as the team understands the wall
Systems Integration
On some larger projects, you may have multiple teams working on different components of a system that need to be integrated later. Some of these components may involve hardware or firmware and may be not amenable to modern continuous-integration techniques.
When you have such components that need to be integrated:
- Determine an integration point based on a coarse-grained high-level planning activity.
- This point should then be treated as a fixed date for delivery of these dependent components.
- This allows each team to move forward independently with its kanban system, but also to coordinate delivery of dependent items when they are needed.
Managing People Shared Across Teams
It is common on larger projects and across project portfolios to share some specialist resources; for example, software architecture, database architecture and administration, user-experience testing, user-experience design, and software security audit. There are three established methods for dealing with these shared resources in Kanban.
- In the first method some of the work items have additional, smaller orange tickets attached to them. These smaller tickets show the name of a required shared resource, such as Sandy, the enterprise data architect. At the lowest level of intrusion, this act of visualizing the work of the shared resource is often enough to coordinate that individual’s workload. If several tickets start appearing with the same name, it can bring up questions about how this person is managing to work on multiple things all at one time. This might be enough to facilitate a policy-change discussion— does all the work need to be seen by that person?— or to escalate it to the next level.
- The next level is to recognize that shared resources are not instantly available, and to visualize that by marking items requiring attention from a shared resource (an orange ticket), as blocked until the person is actively working on them. This has the effect of invoking the issue-management and resolution function to resolve the availability of the shared resource. It also has the effect of highlighting to management whether or not this resource’s availability is a problem and a potential bottleneck.
- The highest level of management for a shared resource is to give that resource its own kanban system. For example, enterprise data architecture could have its own kanban system, so could user experience, and software security, and so on and on. Each team or resource would independently analyze its demand and set work item types based on the source of request, and classes of service based on priority and response required. The demand would be analyzed and policies for capacity allocation set.
At this (third) level, what has emerged is a service-oriented architecture for actually developing the software itself. Each group within the enterprise offers its own set of services that are exhibited as service-level agreements for different classes of service and work item types. Clients of those shared resources then submit work requests to their backlog; those requests are queued and selected for processing, just as described throughout this book. If requests from a given client are not being processed quickly enough, it can open up discussion about whether or not the system is designed correctly, and whether or not policies about capacity allocation and class of service need to change. It may even provide sufficient evidence for realigning or augmenting staffing.
Operations Reviews
- I truly believe that (this review) is essential to delivering a successful enterprise-scale Lean (or Agile) transition.
- Objective, data-driven retrospective on the organization’s performance, i.e., covers all departments or projects
- Sets expectation of objective, data-driven, quantitative management rather than the typical agile qualitative, subjective retrospective
- Provides a monthly feedback loop that enables growth of organizational maturity and organization-level continuous improvement.
- Includes staff, management, executives from the area value stream partners guests
Two Hour Meeting Agenda
Set a business tone via a brief update - remind everyone we are running a business:
- Management action item update (from the last meeting)
- Company financial performance summary (meeting held after monthly close)
- Software group financial performance
- Planned vs. actual per cost center/project
- Headcount targets, requisitions
Guest speaker, value stream partner:
- Present to the group topics about their work
- They experience the transparency
Main Agenda:
- Each manager has 8 minutes to present metrics from the above for their department, take questions. Occasionally deep dive a specific topic
- Discuss current events:
- Problems impacting the organization e.g. major project issues, cross value stream challenges etc.
- Celebrate success
A Cautionary Tale
After I left Corbis at the beginning of 2008, my former boss reduced the cadence of the operations reviews to quarterly to save money. After three-quarters, and with that boss also gone, the new leadership questioned the value of the meetings and decided to cancel them altogether. Within another few months the performance of the organization had allegedly depreciated considerably, and the level of organizational maturity had reportedly fallen back from approximately the equivalent of CMMI Model Level 4 to CMMI Model Level 2, from Quantitatively Managed to merely Managed.
We can draw several things from this. The loss of a feedback loop reduced the opportunities for reflection and adaptation that could lead to improvements. Eliminating a meeting focused on objective performance review of the organization sent a message that leadership no longer cared about performance. The result was a significant step backward in organizational maturity and performance in terms of predictability, quality, lead times, and throughput.
No comments:
Post a Comment
Please no spam, advertisements, or unrelated personal discussions.